Real Time Automated System
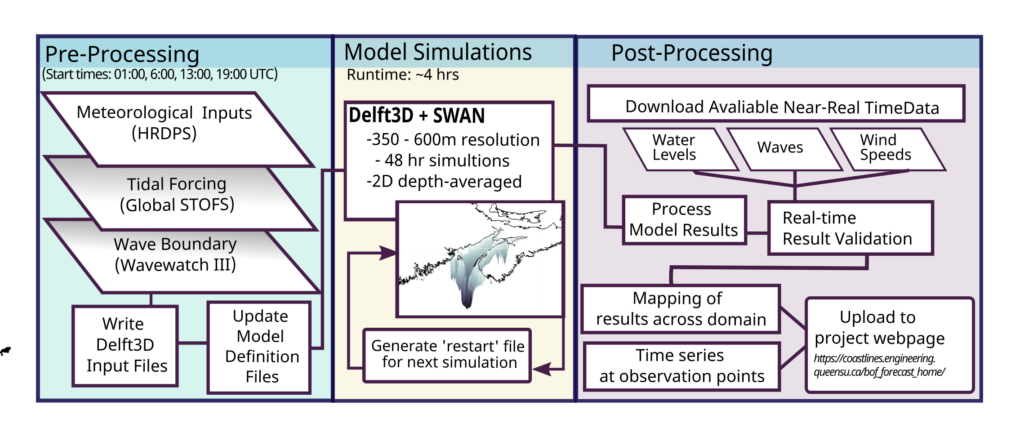
The real-time model provides predictions of water levels and wave characteristics throughout the Bay of Fundy. The model is forced using high resolution spatially varied wind and pressure fields from the High resolution Deterministic Prediction System and boundary conditions for water levels from the Storm Tide Operational Forecast System (STOFS) and waves from Wavewatch III. Simulations start every 6 hours, providing 48 hour forecasts, with approximately a 5 hour delay between model start time and updated online results.
The workflow diagram of the automated processes in python and Matlab is shown below.
Model Inputs
Wind Inputs
Simulations are forced using meteorological inputs from the High resolution deterministic Prediction System (HRDPS) by Environment Canada. This provides hourly wind speeds and atmospheric pressure predictions with a spatial resolution of 2.5 km.
HRDPS provides forecast data out to 48 hr from the forecast start time, every 6 hrs (ie. 00hr, 6hr, 12 hr, and 18hr)
Time series plot of the total predicted HRDPS wind speeds are compared to observed wind data measured at various locations in the Bay of Fundy here.
Water Level Boundaries
Water levels along the open boundary are provided by NOAA’s global, 2-D Storm and Tides Operational Forecast System (STOFS). STOFS provides combined harmonic tidal forcing and wind-driven surge forecasts, based on hydrodynamic results from an ADCIRC simulation.
Boundary data is accessed from the AWS data repository (https://registry.opendata.aws/noaa-gestofs/) using MATLAB. Boundary files for Delft3D are generated, with 12 boundary segments.
Wave Boundaries
Incoming wave characteristics (wave height, period, direction) are accounted for from forecasts from Wavewatch III. The Global Forecast System (GFS) provides wave forecast 4 times/day, with a temporal resolution of 3 hours. These forecasts are accessed via Matlab through NOMADS.
Bathymetric Data
Bathymetric data for the Bay of Fundy is available through NOAA’s eastern Canada 3 arcsecond bathymetric digital elevation model. Data is downloaded, and interpolated to the computational grid via grid cell averaging.
Observed Data Sources
Real-time observed data used for qualitative validation of results is available from the following sources:
- Environment Canada
- NOAA Tides and Currents
- National Data Buoy Center (NDBC)